Financial Position
Financial position of the Group
The Volkswagen Group’s gross cash flow was €35.6 billion in fiscal year 2018, an increase of 9.1% compared with the prior-year figure. Administrative fines imposed after regulatory offense proceedings, which were recognized as special items in connection with the diesel issue in the reporting period, led to cash outflows. The rise in working capital led to tied-up funds in the amount of €−28.3 (−33.8) billion. The €5.5 billion change reflects the significant decrease in cash outflows attributable to the diesel issue in the reporting period, set against a WLTP-related increase in inventories. As a result, cash flows from operating activities were up by €8.5 billion to €7.3 billion.
The Volkswagen Group’s investing activities attributable to operating activities stood at €19.4 billion, 6.4% more than in the previous year.
Cash inflows from financing activities amounted to €24.6 (17.6) billion. The figure mainly comprises the issuance and redemption of bonds and other financial liabilities. Financing activities also include the dividends paid to the shareholders of Volkswagen AG, the acquisition of MAN shares tendered following the ruling in the award proceedings, the successful placement of dual-tranche hybrid notes in June 2018, and the redemption of the hybrid notes terminated in the third quarter of 2018.
At the end of the reporting period, the Volkswagen Group’s cash and cash equivalents as reported in the cash flow statement amounted to €28.1 (18.0) billion and were thus significantly up on the prior-year reporting date.
On December 31, 2018, the Volkswagen Group’s net liquidity was €−134.7 billion, compared with €−119.1 billion at the end of 2017.
| (XLS:)
|
CASH FLOW STATEMENT BY DIVISION |
||||||||||||||||||||||||||
|---|---|---|---|---|---|---|---|---|---|---|---|---|---|---|---|---|---|---|---|---|---|---|---|---|---|---|
|
VOLKSWAGEN GROUP |
AUTOMOTIVE1 |
FINANCIAL SERVICES |
|||||||||||||||||||||||
€ million |
2018 |
20172 |
2018 |
20172 |
2018 |
20172 |
||||||||||||||||||||
|
||||||||||||||||||||||||||
|
|
|
|
|
|
|
||||||||||||||||||||
Cash and cash equivalents at beginning of period |
18,038 |
18,833 |
13,428 |
14,125 |
4,609 |
4,709 |
||||||||||||||||||||
Earnings before tax |
15,643 |
13,673 |
12,861 |
11,171 |
2,782 |
2,502 |
||||||||||||||||||||
Income taxes paid |
−3,804 |
−3,664 |
−3,786 |
−3,514 |
−19 |
−149 |
||||||||||||||||||||
Depreciation and amortization expense3 |
22,561 |
22,165 |
15,581 |
14,948 |
6,980 |
7,218 |
||||||||||||||||||||
Change in pension provisions |
524 |
468 |
503 |
452 |
21 |
15 |
||||||||||||||||||||
Share of the result of equity-accounted investments |
244 |
274 |
303 |
159 |
−58 |
115 |
||||||||||||||||||||
Other noncash income/expense and reclassifications4 |
445 |
−265 |
502 |
202 |
−56 |
−467 |
||||||||||||||||||||
Gross cash flow |
35,613 |
32,651 |
25,964 |
23,418 |
9,650 |
9,233 |
||||||||||||||||||||
Change in working capital |
−28,341 |
−33,836 |
−7,433 |
−11,732 |
−20,908 |
−22,104 |
||||||||||||||||||||
Change in inventories |
−5,372 |
−4,198 |
−5,337 |
−3,784 |
−34 |
−414 |
||||||||||||||||||||
Change in receivables |
−6,400 |
−1,660 |
−1,800 |
−937 |
−4,600 |
−724 |
||||||||||||||||||||
Change in liabilities |
3,645 |
5,302 |
2,793 |
4,168 |
853 |
1,134 |
||||||||||||||||||||
Change in other provisions |
−1,286 |
−9,910 |
−1,306 |
−10,079 |
20 |
169 |
||||||||||||||||||||
Change in lease assets (excluding depreciation) |
−11,647 |
−11,478 |
−1,590 |
−1,115 |
−10,056 |
−10,363 |
||||||||||||||||||||
Change in financial services receivables |
−7,282 |
−11,891 |
−191 |
15 |
−7,090 |
−11,906 |
||||||||||||||||||||
Cash flows from operating activities |
7,272 |
−1,185 |
18,531 |
11,686 |
−11,258 |
−12,871 |
||||||||||||||||||||
Cash flows from investing activities attributable to operating activities |
−19,386 |
−18,218 |
−18,837 |
−17,636 |
−549 |
−583 |
||||||||||||||||||||
of which: investments in property, plant and equipment, investment property and intangible assets, excluding capitalized development costs |
−13,729 |
−13,052 |
−13,218 |
−12,631 |
−510 |
−421 |
||||||||||||||||||||
capitalized development costs |
−5,234 |
−5,260 |
−5,234 |
−5,260 |
– |
– |
||||||||||||||||||||
acquisition and disposal of equity investments |
−705 |
−317 |
−594 |
−124 |
−111 |
−193 |
||||||||||||||||||||
Net cash flow 5 |
−12,113 |
−19,404 |
−306 |
−5,950 |
−11,807 |
−13,454 |
||||||||||||||||||||
Change in investments in securities, loans and time deposits |
−2,204 |
1,710 |
6,129 |
2,333 |
−8,332 |
−622 |
||||||||||||||||||||
Cash flows from investing activities |
−21,590 |
−16,508 |
−12,708 |
−15,303 |
−8,882 |
−1,205 |
||||||||||||||||||||
Cash flows from financing activities |
24,566 |
17,625 |
4,274 |
3,562 |
20,292 |
14,063 |
||||||||||||||||||||
of which: capital transactions with noncontrolling interests |
−28 |
– |
−28 |
– |
– |
– |
||||||||||||||||||||
Capital contributions/capital redemptions |
1,491 |
3,473 |
1,418 |
2,400 |
73 |
1,073 |
||||||||||||||||||||
MAN noncontrolling interest shareholders: compensation payments and acquisition of shares tendered |
−2,117 |
−118 |
−2,117 |
−118 |
– |
– |
||||||||||||||||||||
Effect of exchange rate changes on cash and cash equivalents |
−173 |
−727 |
−171 |
−641 |
−2 |
−86 |
||||||||||||||||||||
Change of loss allowance within cash and cash equivalents |
−1 |
– |
−1 |
– |
0 |
– |
||||||||||||||||||||
Net change in cash and cash equivalents |
10,075 |
−796 |
9,925 |
−696 |
150 |
−99 |
||||||||||||||||||||
|
|
|
|
|
|
|
||||||||||||||||||||
Cash and cash equivalents at Dec. 316 |
28,113 |
18,038 |
23,354 |
13,428 |
4,759 |
4,609 |
||||||||||||||||||||
Securities, loans and time deposits |
28,036 |
26,291 |
8,697 |
15,201 |
19,339 |
11,090 |
||||||||||||||||||||
Gross liquidity |
56,148 |
44,329 |
32,051 |
28,630 |
24,098 |
15,699 |
||||||||||||||||||||
Total third-party borrowings |
−190,883 |
−163,472 |
−12,683 |
−6,251 |
−178,200 |
−157,221 |
||||||||||||||||||||
Net liquidity7 |
−134,735 |
−119,143 |
19,368 |
22,378 |
−154,103 |
−141,522 |
||||||||||||||||||||
AUTOMOTIVE DIVISION NET CASH FLOW 2018
€ billion
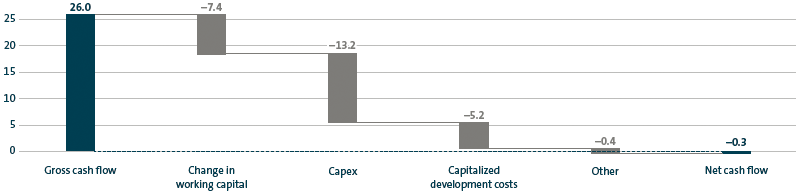
Financial position of the Automotive Division
The Automotive Division’s gross cash flow amounted to €26.0 billion in fiscal year 2018, €2.5 billion more than a year earlier. The increase was mainly due to healthy earnings growth. Special items recognized in the reporting period, most of which have already led to cash outflows, and a year-on-year decline in dividends from the Chinese joint ventures had a negative impact. The change in working capital of €−7.4 (−11.7) billion was €4.3 billion lower than in the previous year; it mainly reflects the significant decrease in cash outflows attributable to the diesel issue in the reporting period set against a WLTP-related increase in inventories. As a result, cash flows from operating activities rose by €6.8 billion to €18.5 billion.
Investing activities attributable to operating activities increased by €1.2 billion to €18.8 billion. Investments in property, plant and equipment, investment property and intangible assets, excluding capitalized development costs (capex), were 4.6% higher, at €13.2 billion. The ratio of capex to sales revenue was 6.6 (6.5)%. We invested mainly in our production facilities and in models that we launched in the reporting period or are planning to launch next year. These are primarily the Touareg, T-Cross, Audi e-tron, Audi Q3, Audi A6, Porsche 911 and Porsche Taycan model series, and the Bentley Continental family. Other investment priorities included the ecological focus of our model range, product electrification and digitalization, and our modular toolkits. Capitalized development costs of €5.2 (5.3) billion were in line with 2017 levels. Within the “Acquisition and disposal of equity investments” item, the sale of a part of the shares in There Holding was offset mainly by the investment in the newly established joint venture with Anhui Jianghuai Automobile (JAC) and the acquisition of additional shares in Quantum Scape. The prior-year figure had included the acquisition of the shares in Navistar and the disposal of part of the PGA Group.
Due mainly to markedly lower cash outflows attributable to the diesel issue, net cash flow in the Automotive Division improved by €5.6 billion to €−0.3 (−6.0) billion compared with the previous year.
Cash inflows from financing activities amounted to €4.3 (3.6) billion in fiscal year 2018. In May 2018, a dividend totaling €2.0 billion was distributed to the shareholders of Volkswagen AG, €1.0 billion more than in the previous year. The successful placement of dual-tranche hybrid notes with an aggregate principal amount of €2.75 billion via Volkswagen International Finance N.V. in June 2018 resulted in a cash inflow. The notes consist of a €1.25 billion note that carries a coupon of 3.375% and has a first call date after six years, and a €1.5 billion note that carries a coupon of 4.625% and has a first call date after ten years. Both tranches are perpetual and, net of transaction costs and other factors, increase equity. €2.75 billion of the hybrid notes were classified as a capital contribution, which increased net liquidity. The redemption of the hybrid notes terminated in the third quarter of 2018 caused a cash outflow of €1.25 billion in the reporting period. Financing activities also include the issuance and redemption of bonds and other financial liabilities, as well as the MAN shares tendered as a result of the award proceedings and shares in AUDI AG acquired in the fiscal year.
The Automotive Division’s net liquidity was €19.4 billion on December 31, 2018, €3.0 billion lower than at the end of fiscal year 2017. The Automotive Division’s net liquidity stood at 8.2 (9.7)% of consolidated sales revenue in fiscal year 2018.
| (XLS:)
|
FINANCIAL POSITION IN THE PASSENGER CARS BUSINESS AREA |
||||
|---|---|---|---|---|
€ million |
2018 |
2017 |
||
|
|
|
||
Gross cash flow |
21,808 |
19,410 |
||
Change in working capital |
−5,938 |
−10,122 |
||
Cash flows from operating activities |
15,870 |
9,289 |
||
Cash flows from investing activities attributable to operating activities |
−16,194 |
−15,337 |
||
Net cash flow |
−325 |
−6,048 |
||
In fiscal year 2018, the Passenger Cars Business Area’s gross cash flow improved by €2.4 billion to €21.8 billion. The increase was mainly due to healthy earnings growth; cash outflows associated with special items recognized in the reporting period had an offsetting effect. At €−5.9 (−10.1) billion, the negative impact on the change in working capital was less than in the year before, especially because of significantly lower cash outflows attributable to the diesel issue; this was set against a WLTP-related increase in inventories. Consequently, cash flows from operating activities went up by €6.6 billion to €15.9 billion. Investing activities attributable to operating activities of €16.2 (15.3) billion were up on 2017 levels. Capex grew, while capitalized development costs declined. In the reporting period, the sale of some of the shares in There Holding was offset by the investment in the joint venture with Anhui Jianghuai Automobile (JAC) and the acquisition of additional shares in Quantum Scape. In the prior-year period, the sale of part of the PGA Group had a positive effect on this item. Net cash flow increased to €−0.3 (−6.0) billion.
| (XLS:)
|
FINANCIAL POSITION IN THE COMMERCIAL VEHICLES BUSINESS AREA |
||||
|---|---|---|---|---|
€ million |
2018 |
2017 |
||
|
|
|
||
Gross cash flow |
3,847 |
3,739 |
||
Change in working capital |
−1,234 |
−1,320 |
||
Cash flows from operating activities |
2,613 |
2,419 |
||
Cash flows from investing activities attributable to operating activities |
−2,480 |
−2,122 |
||
Net cash flow |
132 |
297 |
||
The Commercial Vehicles Business Area’s gross cash flow was €3.8 (3.7) billion in fiscal year 2018; the slight increase over the previous year was due to higher earnings. The change of funds tied up in working capital decreased by €0.1 billion to €−1.2 billion. As a result, cash flows from operating activities were up on the 2017 figure, increasing to €2.6 (2.4) billion. Investing activities attributable to operating activities stood at €2.5 (2.1) billion. This figure comprises increased capex and higher capitalized development costs mainly for the T7 and Caddy models. The prior-year figure included the acquisition of the shares in Navistar. Net cash flow amounted to €0.1 billion, €0.2 billion lower than a year earlier.
| (XLS:)
|
FINANCIAL POSITION IN THE POWER ENGINEERING BUSINESS AREA |
||||
|---|---|---|---|---|
€ million |
2018 |
2017 |
||
|
|
|
||
Gross cash flow |
309 |
268 |
||
Change in working capital |
−260 |
−290 |
||
Cash flows from operating activities |
49 |
−22 |
||
Cash flows from investing activities attributable to operating activities |
−162 |
−177 |
||
Net cash flow |
−113 |
−199 |
||
The Power Engineering Business Area generated a gross cash flow of €0.3 (0.3) billion in the reporting period. Funds tied up in working capital amounted to €−0.3 (−0.3) billion. Cash flows from operating activities were slightly higher than in the previous year. Investing activities attributable to operating activities stood at €0.2 (0.2) billion. Net cash flow improved by €0.1 billion to €−0.1 billion.
Financial position in the Financial Services Division
In the reporting period, the Financial Services Division’s gross cash flow was €9.6 (9.2) billion. The change in working capital declined by €1.2 billion year-on-year to €−20.9 billion. Cash flows from operating activities amounted to €−11.3 (−12.9) billion.
At €0.5 (0.6) billion, investing activities attributable to operating activities were in line with the previous year.
The Financial Services Division’s financing activities relate primarily to the issuance and redemption of bonds and other financial liabilities; the total cash inflow to refinance the business volume was €20.3 (14.1) billion.
The Financial Services Division’s negative net liquidity, which is common in the industry, stood at €−154.1 billion at the end of the reporting period; at the end of December 2017 it had amounted to €−141.5 billion.