Business Development
The robust growth of the global economy continued in fiscal year 2018 with a slight decrease in momentum. Global demand for vehicles was somewhat lower than in the previous year. Amid persistently challenging market conditions, the Volkswagen Group delivered 10.8 million vehicles to customers.
DEVELOPMENTS IN THE GLOBAL ECONOMY
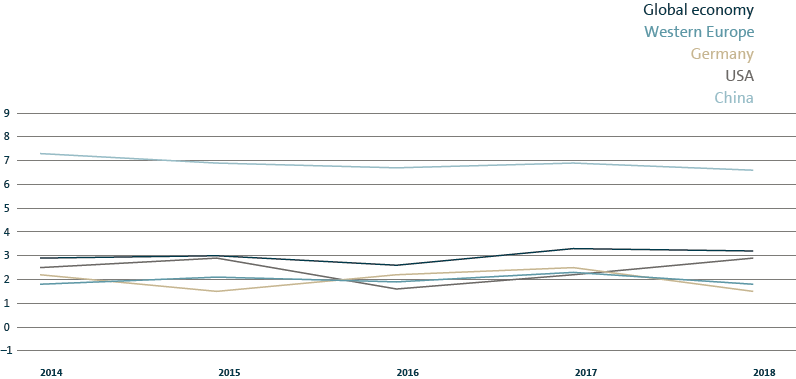
The global economy sustained its robust growth in 2018 with a slight decrease in momentum: global gross domestic product (GDP) rose by 3.2 (3.3)%. Economic momentum nearly matched the prior-year level both in advanced economies and emerging markets. With interest rates remaining comparatively low and prices for energy and other commodities rising year-on-year on the whole, consumer prices continued to increase worldwide. Growing upheaval in trade policy at international level and geopolitical tensions led to much greater uncertainty.
Europe/Other Markets
The solid GDP growth in Western Europe slowed to 1.8 (2.3)% as the year went on. The rate of change in the majority of countries in this region decreased compared with the previous year. The Brexit negotiations between the United Kingdom and the European Union (EU), which continued for the entire year, generated uncertainty, as did the related question of what form this relationship would take in the future. The unemployment rate in the eurozone continued to decrease, falling to an average of 8.1 (9.0)%, though rates remained considerably higher in Greece and Spain.
At 2.9 (4.0)%, the Central and Eastern Europe region also recorded a slower growth rate in the reporting period than in the previous year. While the comparatively high level of GDP growth in Central Europe slowed down on the whole, economic growth in Eastern Europe remained unchanged. Higher prices for energy and other commodities led to further stabilization of the economic situation in the countries from this region that export raw materials. Russia’s economy improved somewhat with a growth rate of 1.6 (1.5)%.
Growth in the Turkish economy slumped substantially to 2.5 (7.3)% after the first half of 2018. South Africa’s GDP rose by just 0.7 (1.3)% in the reporting period, down on the already low figure for the previous year. Ongoing structural deficits, social unrest and political challenges weighed on the economy.
Germany
Germany’s GDP continued to grow in 2018 on the back of the good labor market, however, momentum diminished year-on-year to 1.5 (2.5)%. Both company and consumer sentiment darkened as the year progressed.
North America
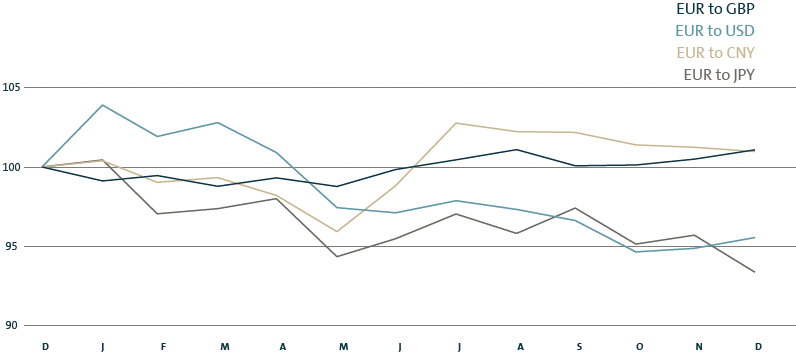
Economic growth in the USA picked up in the reporting period, reaching 2.9 (2.2)%. The economy was supported mainly by domestic consumer demand. The unemployment rate in the United States in 2018 was at 3.9 (4.3)%. Based on the stable situation in the labor market and the expected inflation trend, the US Federal Reserve successively raised its key interest rate. The US dollar gained strength against the euro in the course of the year. In neighboring Canada and Mexico, GDP grew at a slower rate than in the previous year, at 2.1 (3.0)% and 2.2 (2.3)%, respectively.
South America
Brazil’s economy once again recorded slight growth, at 1.4 (1.1)%. However, the situation in South America’s largest economy remained tense due to political uncertainty, among other factors. The economic situation in Argentina deteriorated increasingly as the year went on. The country was in recession amid persistently high inflation: GDP fell by 1.7 (+2.9)%. In view of this difficult situation, the Argentine government requested financial aid from the International Monetary Fund.
Asia-Pacific
China’s economy recorded a growth rate of 6.6 (6.9)% in 2018, but its rate of expansion was not quite as strong as in the previous year. The Chinese government responded to the trade disputes with the United States by stepping up state support measures. The Indian economy continued its positive trend, with growth in the reporting period of 7.2 (6.7)%. However, the pace of growth tapered off in the course of the year. Japan’s GDP grew by only 0.8 (1.9)%.
ECONOMIC GROWTH
Percentage change in GDP

EXCHANGE RATE MOVEMENTS FROM DECEMBER 2017 TO DECEMBER 2018
Index based on month-end prices: as of December 31, 2017 = 100
